Bayesian Estimation Tools

More Views

Bayesian Estimation Tools

Availability: Out of stock

The Bayesian Estimation Tools package provides a suite of pre-built tools for Bayesian estimation and analysis, including data generation, estimation, and post-estimation analysis.
Overview

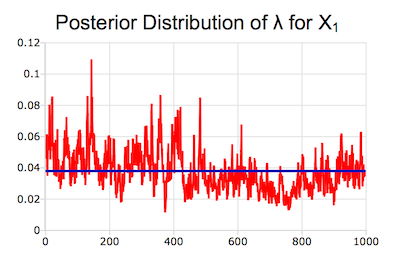
Posterior distribution of lambda
The Bayesian Estimation Tools package provides a suite of tools for estimation and analysis of a number of pre-packaged models. The internal Bayesian models provide quickly accessible, full-stage modeling including data generation, estimation, and post-estimation analysis. Modeling flexibility is provided through control structures for setting modeling parameters, such as burn-in periods, total iterations and others.

Platform: Windows, Mac, and Linux

Requirements: GAUSS/GAUSS Engine/GAUSS Light v13.1 or higher

Features

Data generation tools for building hypothetical data sets:

  • Univariate and multivariate linear models
  • Autoregressive error terms (AR)
  • Hierarchical Bayes (HB)
  • Probit and logit data

Supported models for Markov Chain Monte Carlo (MCMC) Estimation:

  • Univariate and multivariate linear models
  • Autoregressive error terms (AR)
  • Hierarchical Bayes (HB)
  • Probit model
  • Dynamic two-factor model
  • Structural vector autoregressive (SVAR)

Flexible, user defined MCMC estimation parameters including:

  • Number of saved iterations
  • Skipped iterations
  • Burn-in iterations
  • Total number of iterations
  • Inclusion of intercept
  • Optional graph and results output
  • Elective maximum likelihood estimation (MLE) initialization

Thorough computations including:

  • Draws for all parameters at each iteration
  • Posterior mean of parameters
  • Posterior standard deviation of parameters
  • Predicted variable values and residuals
  • Correlation matrix between observed and predicted data
  • PDF values and corresponding PDF graphs
  • Log-likelihood values (when applicable)

Examples

Sample output report for probit model

Model Type: Probit regression model
*************************************************************
Possible underlying (unobserved) choice generation:
Agent selects one alternative:
Y[ij] = X[j]*beta_i + epsilon[ij]
epsilon[ij]~N(0,Sigma)
*************************************************************
Y[ij] is mvar vector
Y[ij] is utility from subject i, choice set j, alternative k
where	i = 1, ..., numSubjects
			j = 1, ..., numChoices
			k = 1, ..., numAlternatives - 1
*************************************************************
X[j] is numAlternative x rankX for choice j
*************************************************************
Pick alternative k if:
Y[ijk] > max( Y[ijl] )
for all k < mvar+1 and l not equal to k
Select base alternative if max(Y)<0
*************************************************************
Observed model:
*************************************************************
Choice vector C[ij] is a numAlternative vector of 0/1
beta_i = Theta'Z[i] + delta[i]
delta[i]~N(0,Lambda)
*************************************************************

Summary stats of independent data

*****************************************
Summary stats for X variables
*****************************************

        Variable             Mean              STD              MIN              MAX 
              X1          0.33333          0.47538                0                1 
              X2          0.33333          0.47538                0                1 
              X3          0.33333          0.47538                0                1 
              X4          0.28648          0.20641        -0.083584          0.71157 
              X5         0.083333          0.59065               -1                1 

*****************************************
Summary stats for Z variables
*****************************************

        Variable             Mean              STD              MIN              MAX 
              Y1         -0.10328           1.1582          -6.1714           3.7266 
              Y2         -0.23821           1.1428          -6.1295           3.2853 
              Y3         -0.28473           1.2776          -5.4752             4.58 

*****************************************
Summary stats for dependent variables
*****************************************

        Variable             Mean              STD              MIN              MAX 
              Y1         -0.10328           1.1582          -6.1714           3.7266 
              Y2         -0.23821           1.1428          -6.1295           3.2853 
              Y3         -0.28473           1.2776          -5.4752             4.58 

***********************************
MCMC Analysis Setup
***********************************
Total number of iterations:     1100.0 
Total number of saved iterations:     1000.0 
Number of iterations in transition period:     100.00 
Number of iterations between saved iterations:     0.0000 
Number of obs:    60.000 
Number of independent variables:    5.0000 
(excluding deterministic terms)
Number of dependent variables:    3.0000 

********************************
MCMC Analysis Results
********************************

***********************************
Error Standard Deviation
***********************************
Variance-Covariance Means(Sigma)

        Equation               Y1               Y2               Y3 
              Y1          0.20831         0.078641         -0.12772 
              Y2         0.078641          0.26217        -0.078051 
              Y3         -0.12772        -0.078051                1 

***********************************
Error Standard Deviation
***********************************
Variance-Covariance Means (Lambda)

        Equation            Beta1            Beta2            Beta3            Beta4            Beta5 
           Beta1         0.038024        0.0084823        0.0050414        -0.010463       -0.0044786 
           Beta2        0.0084823         0.038058        0.0061952       -0.0098521        0.0017846 
           Beta3        0.0050414        0.0061952         0.080755       -0.0086755         0.016158 
           Beta4        -0.010463       -0.0098521       -0.0086755          0.10271        -0.010493 
           Beta5       -0.0044786        0.0017846         0.016158        -0.010493         0.046216 

***********************************
Theta for Z Equation     1.0000 
***********************************

        Variable         PostMean          PostSTD 
          Theta1          0.53176          0.43012 
          Theta2          0.43195          0.35411 
          Theta3        -0.011848       0.00015526 
          Theta4          -2.0511          -1.9772 
          Theta5           1.0605           1.1038 

***********************************
Theta for Z Equation     2.0000 
***********************************

        Variable         PostMean          PostSTD 
          Theta1          0.90016          0.79037 
          Theta2          0.37388          0.19278 
          Theta3         -0.32424         -0.37066 
          Theta4          0.69154          0.85307 
          Theta5         -0.26623         -0.19126 

***********************************
Theta for Z Equation     3.0000 
***********************************

        Variable         PostMean          PostSTD 
          Theta1         -0.24998          -0.2454 
          Theta2         -0.22883         -0.19728 
          Theta3        -0.043585         0.026509 
          Theta4         -0.29718         -0.30046 
          Theta5          0.52032          0.50741 

Product Inquiry

5 + 9 = enter the result ex:(3 + 2 = 5)


Try GAUSS for 14 days for FREE

See what GAUSS can do for your data

© Aptech Systems, Inc. All rights reserved.

Privacy Policy